PROJECT: Plasma Reactors Support by Detailed Global Models
Konstantinos Katsonis, Chloe Berenguer
Institution: DEDALOS Ltd., Thessaloniki, Greece
Project goal: Detailed Global Models (DGM) are nowadays used for characterizing, diagnosing, optimizing and monitoring various plasmas of laboratory and industry interest. In this project, we address DGM modeling meant for plasma reactors.
Date: 17 February 2017
Methods: Detailed Global Models pertaining to various feed components are used to support plasma reactors types. Optical Emission Spectroscopy (OES) is used for diagnostics in conjunction with the DGM results.
i) A Titanium Detailed Global Model for Plasma Reactor Support
Technical Report, February 2017
DOI: 10.13140/RG.2.2.15185.74087 ·
Report number: DED-2017-01
Konstantinos Katsonis, Chloe Berenguer
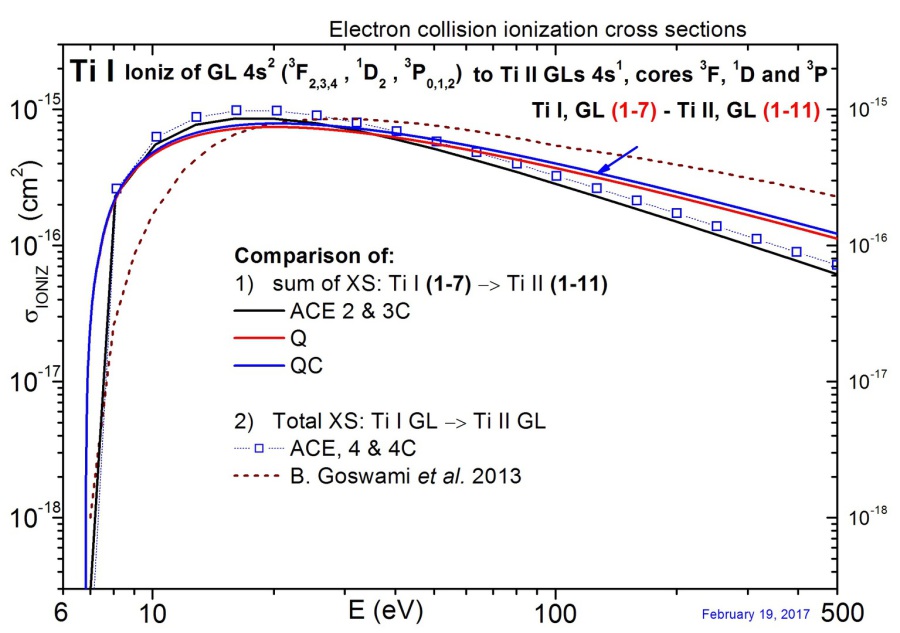
ii) Ti I Ionization Cross Sections
Sum of evaluated electron collision ionization cross sections of Ti QC Quasi-Classical evaluations compared to calculations made by DW code available by LANL and to published results
Data, February 2017
Konstantinos Katsonis, Chloe Berenguer
iii) Theoretical Ti I & Ti II spectrum from TiDGM global model for titanium in plasma reactor
Data, March 2017
Konstantinos Katsonis, Chloe Berenguer
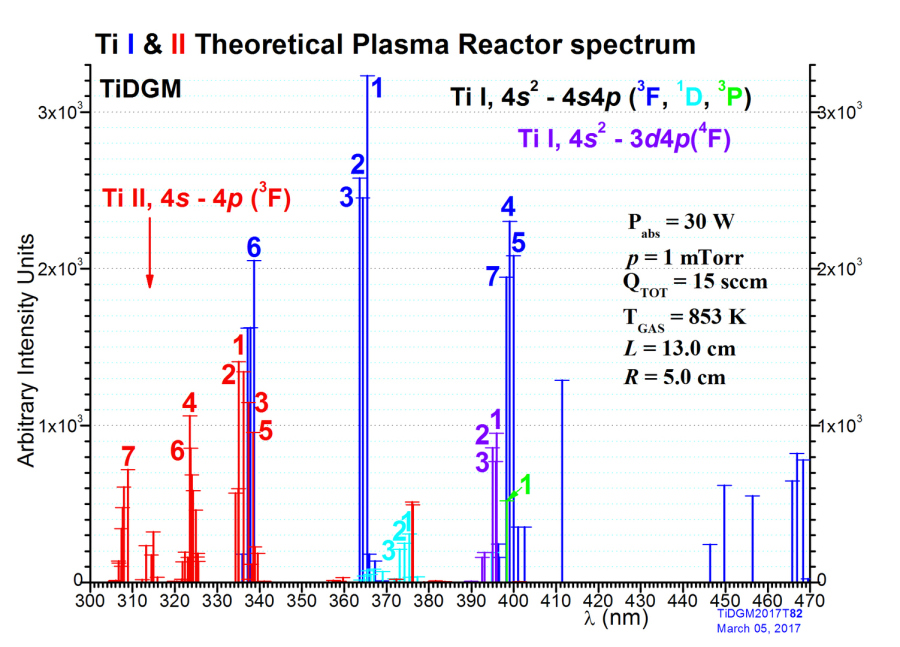
Description
The figure shows an extended version of a theoretical Ti I & II spectrum from TiDGM further to the one presented previously. L and R are the plasma reactor form factor dimensions, belonging to a cylindrincal form. p = 1 mTorr is the reference pressure, corresponding to a feed of QTOT = 15 sccm. The gas temperature is taken as TGAS = 853 K. Besides the Ground Level configurations 4s2 and 4s for Ti I & Ti II correspondingly, the considered excited levels of the 4s4p and 3d4p and of the 4p configurations are marked. The corresponding cores contained in the model are also given. Besides our own evaluations, calculations available on line by LANL (Clark, R.E.H., Abdallah Jr., J., Czanak, G., Mann, J.B., and Cowan, R.D., "ACE: Atomic Collisions with Electrons", Report LA-11436-M, vol. II, Los Alamos, USA, 1988) and data from NIST (Kramida A., Ralchenko Yu., Reader J. and NIST ASD Team) have been used.
iv) Plasma Component Composition (PCC) diagram as a function of the pressure, obtained by TiDGM
Data, March 2017
DOI: 10.13140/RG.2.2.31018.41927
Konstantinos Katsonis, Chloe Berenguer

Description
This typical PCC diagram shows expected populations of the components, for pressures from 1 mTorr to 10 mTorr. Conditions as described in the figure.
v) A PCC concomitant diagram for ionization percentage and temperatures
Data, March 2017
DOI: 10.13140/RG.2.2.20952.08965
Konstantinos Katsonis, Chloe Berenguer

Description
In this diagram, concomittant of the PCC shown in item iv) we present the total ionization percentage TOT which is here about the same with the electron percentage (black circles ●, values to be read at the right side of the figure), which is about 24 % for 1 mTorr and becomes smaller than 1% for 10 mTorr. We also observe that Te (red squares ■, values to be read at the left side of the figure) becomes higher for small pressure values in the case of interest here. Note that the gas temperature TGAS was multiplied by ten in order to be better appreciated in the figure.
vi) Extended theoretical Ti / Ti+ spectra from TiDGM
Data, March 2017
Konstantinos Katsonis, Chloe Berenguer

Description
Main lines of theoretical Ti / Ti+ spectra obtained by TiDGM from 300 nm up to 550 nm. Conditions, multiplets and cores as described in the figure.
The figure presents Ti I, II spectral lines in a region larger than this of iii). It concerns 4s2 - 4s4p(3F,1D,3P) and 4s2 - 3d4p(4F) cores of Ti I and 4s-4p(3F) cores of Ti II.